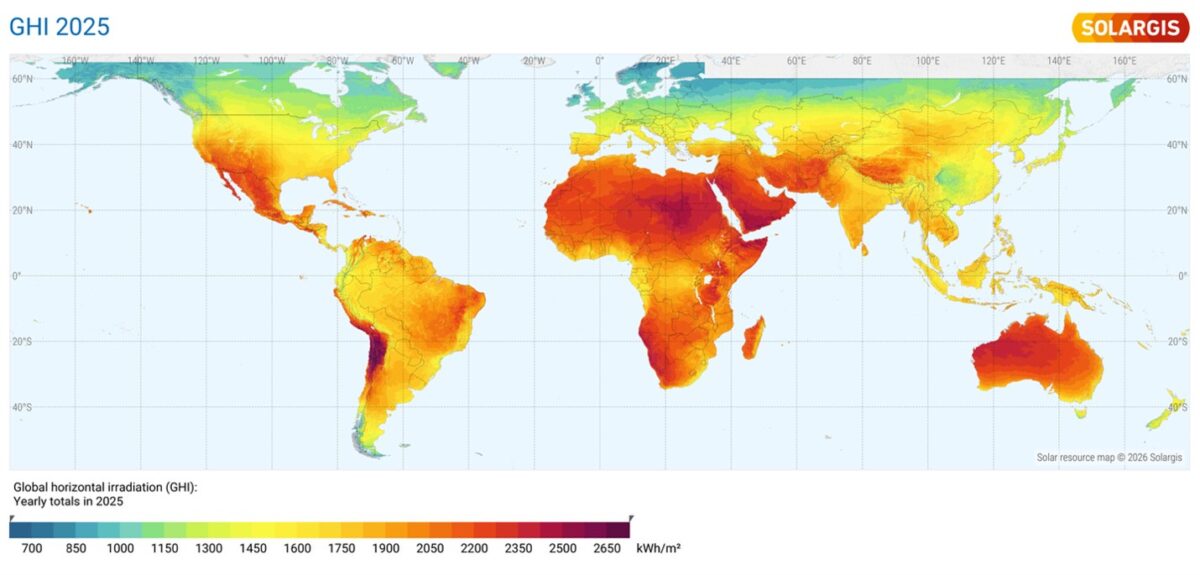
Photovoltaics have been the fastest-growing electricity generation technology for a decade now. Variations in the solar radiation resource availability directly affect both the expected supply and the economics of this technology, which will be dominant by the end of the current decade. In 2025, global solar irradiation reached both positive and negative extremes all over the world, with the highest positive deviations reaching as much as 20% above the long-term average (LTA). In East Asia, solar irradiation was between +15 and +20% above LTA, while Central America and parts of Latin America experienced the most pronounced shortcomings, with solar irradiation -7 to -14% below the LTA. Southeastern Australia and New Zealand recorded above-average solar radiation, generally in the range of +3% to +10%. India experienced strong negative anomalies, especially along the west coast, with up to -10% irradiation below LTA.
With another record year in 2025, global solar PV installations reached around 650 GW. At a 20% annual growth rate, by the end of the current decade, there will be more PV capacity installed worldwide than the sum of all the other electricity generation technologies combined.
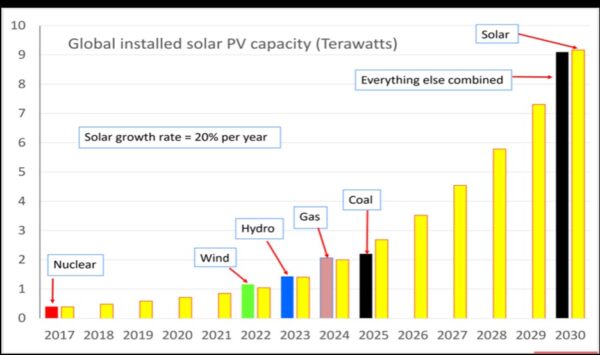
Image: ISES
The current geopolitical scenario calls for even larger growth rates for renewable, decentralized and affordable energy generation technologies such as solar and wind. Solar PV has a lot of room for further growth, and production capacity is available to welcome more demand. PV uptake could nearly double immediately with the current and planned polysilicon, wafer, cell and module assembly capacity as shown below. With several companies beginning to commercially offer perovskite-Si tandem PV modules and the promise of stable efficiencies in the 30% range by the end of the decade, the PV landscape will undergo a new phase of development.
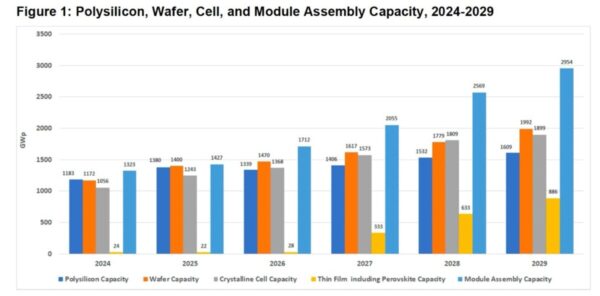
Image: ISES
The 2025 Global Horizontal Irradiation difference maps, recently published by Solargis, show significant differences in global solar irradiation in comparison with the long-term average LTA values. Solar dimming and brightening and PV power plant output performance issues are becoming common events, with consequences on large-scale PV power plant project development and financing. Global solar irradiation experienced both positive and negative extremes last year, with the highest positive deviations reaching up to 20% above the LTA. The solar resource overview in maps, which was previously presented with a standard colour code with a variation of -12% to +12%, had to have the range expanded to -14% to +14% due to an extreme anomaly in China. Solargis presented the following highlights for these variations:
- East Asia stood out in 2025, with solar irradiance reaching +15% to +20% above long-term averages.
- Western and Central–Southeastern Europe also enjoyed a sunnier year, with GHI typically +4% to +10% above normal across much of the region.
- Southeast Australia and New Zealand recorded significantly above-average irradiance, in the range of +3% to +10%.
- In contrast, most of the Indian subcontinent experienced a below-normal year, with GHI -1% to -8% lower than average, and the strongest negative anomalies along the southwest coast, reaching up to −10%.
- Central America and parts of Latin America saw some of the most pronounced deficits globally, with solar irradiance -7% to -14% below long-term averages.
It is still too early to assume these anomalies will become normal, but a trend is emerging. The world map below shows the differences in GHI 2025 from the long-term averages.
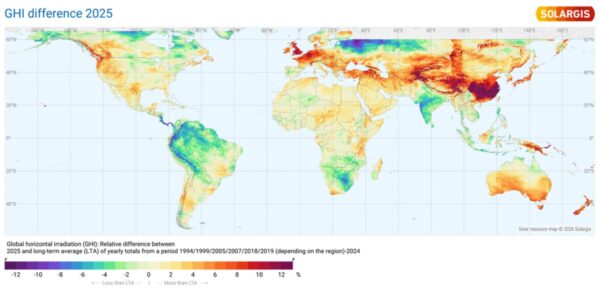
Image: ISES
Comparing the 2025 GHI (kWh/m2.year) with the 2025 GHI difference (percentage deviation from the long-term average), sunbelt regions – where most of the new large-scale PV capacity is being installed – are at the same time the sunniest regions on Earth, and where most positive deviations from the LTA were measured in 2025, with the exception of India and South Africa.

Image: ISES
Authors: Prof. Ricardo Rüther (UFSC), Prof. Andrew Blakers /ANU
ISES, the International Solar Energy Society is a UN-accredited membership NGO founded in 1954 working towards a world with 100% renewable energy for all, used efficiently and wisely.
The views and opinions expressed in this article are the author’s own, and do not necessarily reflect those held by pv magazine.
This content is protected by copyright and may not be reused. If you want to cooperate with us and would like to reuse some of our content, please contact: editors@pv-magazine.com.


By submitting this form you agree to pv magazine using your data for the purposes of publishing your comment.
Your personal data will only be disclosed or otherwise transmitted to third parties for the purposes of spam filtering or if this is necessary for technical maintenance of the website. Any other transfer to third parties will not take place unless this is justified on the basis of applicable data protection regulations or if pv magazine is legally obliged to do so.
You may revoke this consent at any time with effect for the future, in which case your personal data will be deleted immediately. Otherwise, your data will be deleted if pv magazine has processed your request or the purpose of data storage is fulfilled.
Further information on data privacy can be found in our Data Protection Policy.