According to Bridge To India, the total installed open access (OA) solar PV capacity of India will almost double from 2,894 MW at present, to 5,695 MW by end 2022, adding an average 690 MW annually. States with transparent policy regimes and attractive OA charge exemptions—Andhra Pradesh, Uttar Pradesh and Haryana—will lead the market.
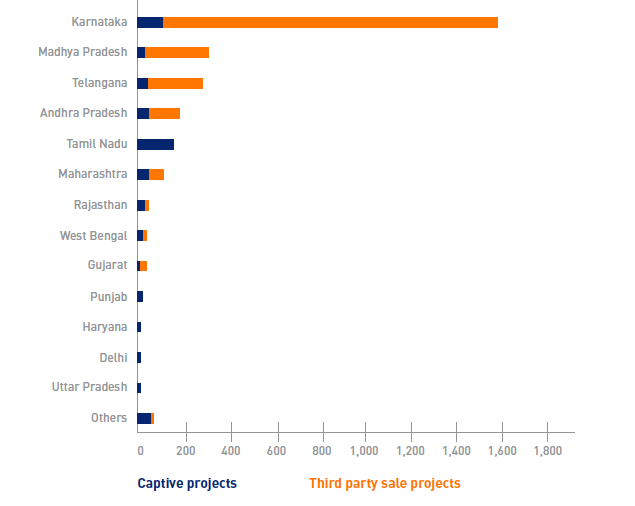
Currently, Karnataka leads the market in terms of installed capacity (1,592 MW). It saw a surge in capacity additions in 2017 and Q1 2018 specifically, due to the attractive state policy, which expired at the end of March 2018.
Karnataka is followed by Madhya Pradesh (332 MW), Telangana (322 MW), Andhra Pradesh (208 MW) and Tamil Nadu (164 MW). In contrast, states such as Rajasthan and Maharashtra, continue to lag despite favourable location and high demand, due to high OA charges, regulatory bottlenecks and unfavourable policy framework.
It is to be noted that commercial and industrial (C&I) customers account for 51% of total power consumed in India, the bulk of which is supplied by DISCOMs. The long-term OA market accounts for just 4%, while its net share in total C&I power consumption is only 0.5%.
Challenges to growth
Despite the various compelling benefits, the total installed OA solar capacity (2,894 MW as of March 2018) is just 12% of India’s total solar capacity.
The Bridge To Report notes that the market is held back by severe policy challenges and, to some extent, cheap short-term power availability from exchanges. Policy challenges include frequent changes in OA charges, difficulty in obtaining project approvals and, most importantly, resistance from DISCOMs and other state agencies.
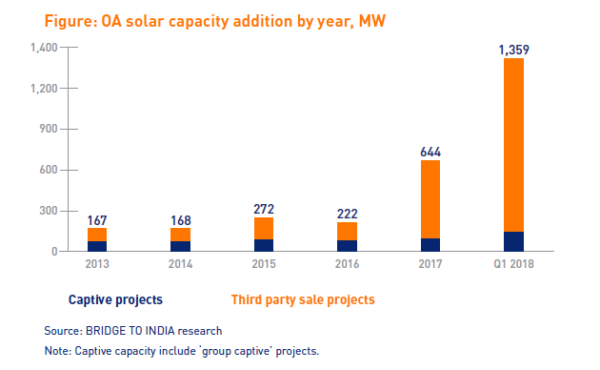
As a result, market growth has been volatile. Unfortunately, unpredictability in the regulatory environment is expected to continue as long as the DISCOMs lose revenue from OA, because of incorrect calibration of OA charges and ad hoc waivers provided under state policies.
Market trends
Third-party sale models have been the dominant business model, and are becoming even more popular as most consumers prefer to outsource complete responsibility of developing, financing and operating the projects to experienced developers.
However, captive projects enjoy lower OA charges and favourable policy treatment. Many projects have been structured as “group captive” projects, but this model is facing increasing scrutiny from regulators.
The OA solar market is also highly fragmented, because of low entry barriers and a challenging/inconsistent policy framework across the country.
Historically, project sizes have been very small (1-5 MW). The market was earlier dominated by regional EPC players, such as Ujaas, Enrich, Emmvee and Rays Power Infra, which used their local business networks to win new business, and source financing from a mix of retail investors and SME businesses on a piecemeal basis.
As the market has grown, large independent power producers (ReNew, Avaada and Aditya Birla) and specialist developers (CleanMax, Amplus and Vibrant) have entered the business, and average project size has grown to 20 MW and over. The IPPs own and operate the bulk of OA solar capacity (1,515 MW, 52%).
There is huge investment interest in OA solar projects, because they can potentially offer higher returns than projects selling power to utilities. Tariffs are considerably higher at INR 4.00 (US$ 0.06) plus, compared to about INR 2.45-3.50 (US$ 0.04-0.05) for projects selling power to NTPC, SECI or DISCOMs.
The business is also relatively less competitive.
This content is protected by copyright and may not be reused. If you want to cooperate with us and would like to reuse some of our content, please contact: editors@pv-magazine.com.


By submitting this form you agree to pv magazine using your data for the purposes of publishing your comment.
Your personal data will only be disclosed or otherwise transmitted to third parties for the purposes of spam filtering or if this is necessary for technical maintenance of the website. Any other transfer to third parties will not take place unless this is justified on the basis of applicable data protection regulations or if pv magazine is legally obliged to do so.
You may revoke this consent at any time with effect for the future, in which case your personal data will be deleted immediately. Otherwise, your data will be deleted if pv magazine has processed your request or the purpose of data storage is fulfilled.
Further information on data privacy can be found in our Data Protection Policy.