The Indian renewable energy sector witnessed a significant 2017. The year saw tremendous enthusiasm for solar energy with the highest ever capacity addition and lowest tariffs recorded. Towards the end of the year, the Indian government also made a resolute move to impose anti-dumping/safeguard duties on solar modules imported from China and Malaysia.
Bridge to India summarizes the solar sector status 2017 in five charts.
Annual Capacity addition
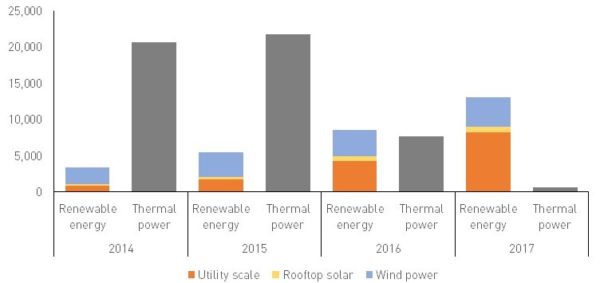
Source: Bridge to India
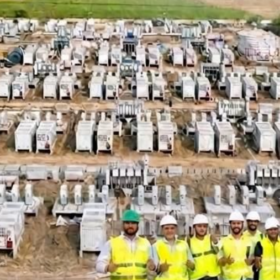
In 2017 Renewable energy surpassed the capacity addition of thermal power. As shown, in 2017 solar and wind capacity additions totaled around 15 GW, out of which solar’s contribution was 10 GW (utility around 8.5 GW and rooftop around 1.4 GW). Whereas thermal was reduced to just 2 GW.
This is significant growth in solar as compared to the years between 2014 to 2016.
Dip in the tariff
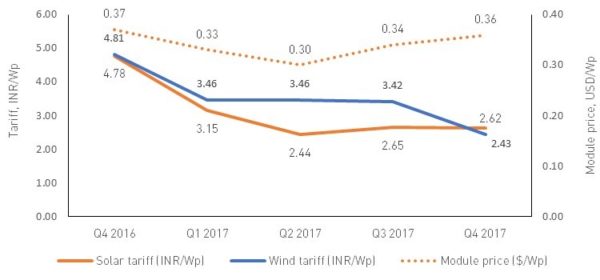
Source: Bridge to India
2017 also witnessed a fall in tariff rates to the lowest price of INR 2.44 ($0.03) /kWh at Bhadla solar park Rajasthan. This itself was lower than the lowest for the year, where Kadapa and Rewa tenders were bid at INR 3.15 ($0.486)/ kWh and INR 3.59 ($0.053) / kWh respectively.
Despite the increase in module costs, and the imposition of GST and import duty, it did not affect growth much, although there was a slight increase in tariff price of INR 2.65 ($ 0.04)/kWh.
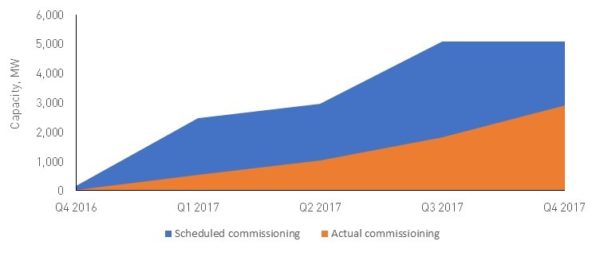
A spot to look
India is making immense effort to encourage solar power by launching huge tenders. However, the completion of auctions remained slow. The falling tariffs did not encourage DISCOMs due to weak power demand.
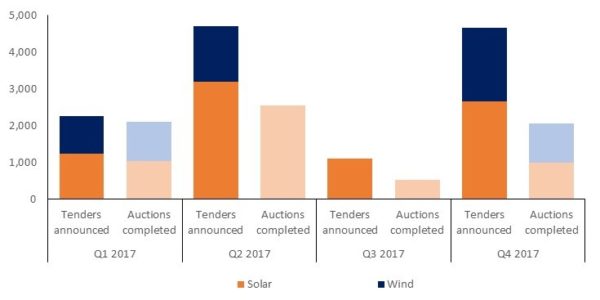
Source: Bridge to India
There were also commissioning delays with developers dealing with various critical issues, like land acquisitions, GST, transport and completion permits. Falling prices also increased the competition and, in one such case, SECI canceled a tender to seek a lower tariff. However, in line with MNRE’s solar roadmap, SECI has tendered 3.2 GW solar projects in the month of January 2018.
Source: Bridge to India
The above chart shows the difference in the actual and scheduled commissioning of the following projects: Karnataka’s 1,200 MW, with SECI’s 920 MW and NTPC 500 MW, Uttar Pradesh 215 MW, Telangana 2,000 MW, and Madhya Pradesh 300 MW.
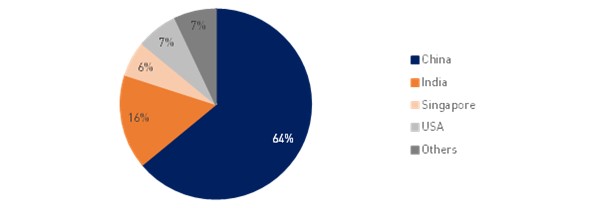
India’s imports
Source: Bridge to India
The above chart is based on 8.2 GW of modules used in utility-scale projects commissioned in 2017. The chart clearly shows that India’s heavy reliance on imports of solar module continues. Despite the Domestic Content Requirement (DCR) and imposing import duties, there is a little to be encouraged by for local manufacturers. India’s tussle regarding DCR also was one major issue, where the U.S. has dragged India back to the WTO. However, India said it has complied with the WTO ruling and has recently published the statement stating the compliance proof, dated December 14, 2017.
This content is protected by copyright and may not be reused. If you want to cooperate with us and would like to reuse some of our content, please contact: editors@pv-magazine.com.


“The solar status in India in 2017 with schedules, the bridge to India
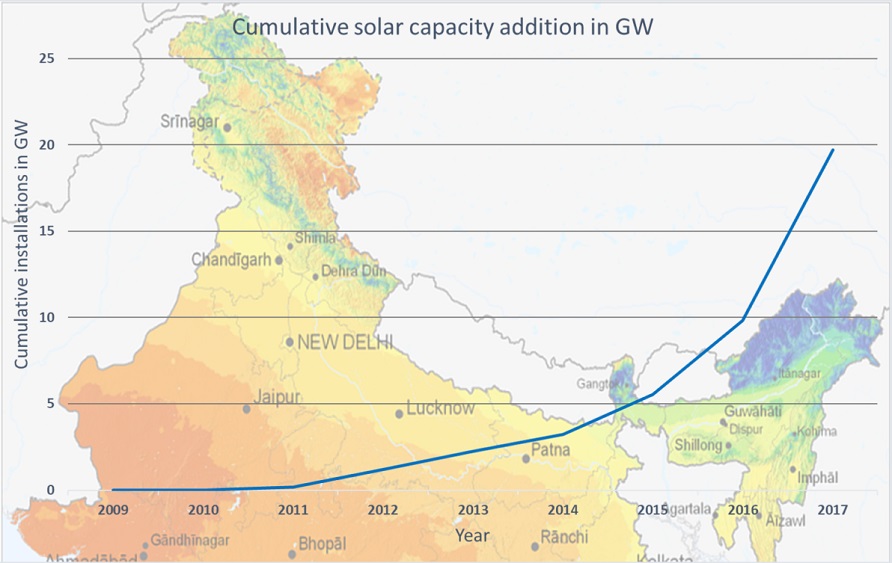
The Indian solar sector has witnessed tremendous growth in 2017. At the end of January 2018, the country has about 20 GW of solar installation. The bridge to India has produced several diagrams comparing renewable installations, tariff rates and forthcoming projects. The data show that India installed in August 2018 a communal scale of 8.5 GW and a solar battery of 1.4 GW.
JANUARY 31, 2018 “.
In principle, in India it is possible and necessary to use the energy of the Sun. It is possible and necessary to use the wind energy. And much more. But you need to choose priorities.
Today, rivers, lakes, and subsoil waters dry up in India. Loss of water, and rising temperatures led to forest fires, and as a result, the appearance of poison smog over Delhi and other megacities. Restoration of the climate, which was before warming, you need to start with the restoration of river level. My programs restore any river, including the Ganges, according to the schedule: First year – 25%; The second – 35%; The third one is 40%.
Activities in the case of replenishment of rivers:
Produced water can be used to increase productive land and pastures. This will give an increase in agricultural products, and new farms.
For the growth of new forests – mostly in the Tar desert – the cooling of the territory of India, and the destruction of poisonous smog. And many other useful environmental works.
Sincerely, developer of environmental programs, Victor Rodin. Ukraine. Khmelnitsky NPP. Tel. Kiev Star: 961336344. Addresses on the Internet: rodin.vik@yandex.ua, dorosydos@gmail.com.