
If you work in solar you are destined to hear or come across the term P50 or P90 or P99. This, at first, is a very confusing concept. The ‘P’ stands for Probability and the number trailing it is the probability level (e.g. 50%, 90%, 99%). However, probability is inherently quite difficult to understand for us humans.
We like determinism; cause and effect. Don’t do homework, I get a bad grade on my test. Train for a sport and increase in aptitude. Stop doing cardio and I am out of breath after a flight of stairs. Cause: effect. But let’s drive to the gym, will I get into a car accident? The average American has a car accident every ±700,000 miles. Therefore, we would say that I probably won’t get into a car accident driving to the gym today. But, if I were to guarantee that over the next 40 or so years that I would spend 700,000 miles driving to the gym and back it is likely that I will get into an accident sometime over those 40 years. That is the essence of statistical probability, it can tell how likely something is given a domain.
In the world of solar energy, P50, P90, and P99 represent the probability that a solar project will generate at least a specific amount of electricity in a given year. Like using probability to determine if you will crash driving to the gym, I am endeavoring to walk you through solar probabilities; why they are needed, how they are calculated, and how to use them.
Solar is quite different from other generators of electricity, with the exception of wind. If you build a nuclear power plant, as long as the fissile material comes in and the human operators continue to show up you can all but guarantee the power output of the facility indefinitely. It is roughly deterministic. However, with solar we are dependent on, quite literally, the weather. The weather is not easy to predict. With weather being so unpredictable, how are we to determine the amount of sunlight that happens to hit the modules we placed in this location over a year or lifetime of the solar system? And it is here that we get part of our answer.
Do you know what the weather is going to be tomorrow? You can use any weather app and with a high degree of certainty know what the weather will be for tomorrow. How about this weekend? Well, for me it is five days away so I will keep an eye on it. What about 10 days from now? A Month? What about the wedding being planned for September? The further we are removed from a date the more difficult it is to predict the weather.
However, there is a funny thing about weather that works in the reverse. If you live in the northern hemisphere you know that June will be warmer than December, that April will likely have showers, and the leaves change in the fall. We can have more certainty about the latter statements than a prediction on a given date months out.
With that knowledge in hand, how do we use it to our benefit for solar? Lucky for us, the government funded research stations and private enterprise pays for satellite time to track the weather for every year and every location (at least in the US). We can get down to 5-minute data dating back decades. This is available via NREL (National Renewable Energy Lab) NOAA on-the-ground stations as well as satellite interpolators like SolarAnywhere, Solcast, and SolarGIS.
Temperature, wind, irradiance, cloud cover, precipitation, and much more are tracked and then used to develop a TMY (Typical Meteorological Year) file using a scientific process like the Sandia method. While the math is a bit complex, what we need to know is that 15 to 30 years’ worth of data is used to generate a typical year. The TMY file is then uploaded to your solar energy modeling software and is used to calculate how much energy will be produced by a system. This energy output is considered a P50 energy value and has typically been in an hourly format (8760). Fifty percent of the time the energy will be over, fifty percent under. But, over the lifetime of the system the average of the energy for all years (not counting degradation and unavailability differences year-to-year) will be very close to the output of the model.
So you have designed your system, used a good solar resource (or multiple to compare) to get a TMY file, and have generated a MWh (megawatt-hour) for the first year. You can take that and build a project, right? You can, but if you want to finance a project you will be unable to with a simple P50 number.
When financing a project, having a bank or outside entity give capital to cover the project cost, the organization will expect a rate of return with a high degree of certainty. A coin flip on any given year does not inspire confidence.
Lucky for us, we can use probability to determine a higher likelihood number to take to the banks! Many desire P90 and/or P99 numbers. A P90 means 90% likelihood the energy will be at or exceeding, with 10% being less than the given number. P99 is 99% over, 1% under. It is easiest to show the differences in a bell curve graph.
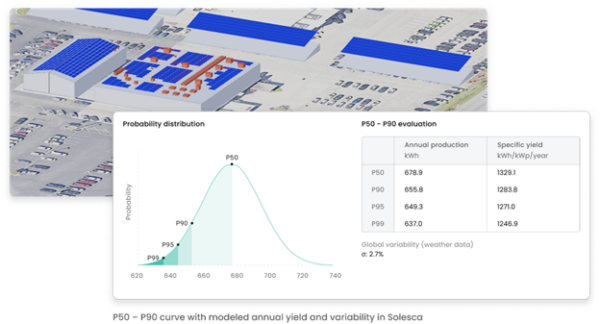
There are two ways of reaching a P90/P99 number from a P50. The first is to take the historical weather data and run multiple models to get a different TMY file. The second, and what Solesca uses, is to take the weather data and P50 data and augment it to P90 and P99 using a model developed in Geneva and widely accepted by the industry.
Both work and have proven to be bankable. If you want to get technical, the Geneva model takes the GHI from the system to get the variability, assumes a gaussian probability distribution, and uses the P50 data and variability to calculate the P values based on standard deviation.
Even though we can’t use these models to predict a given day or year to a high degree of accuracy, we can have a high degree of accuracy over the course of years. P50 numbers are used for asset managers as a target to hit for system production, and can be adjusted for weather. P90 and P99 numbers are used by the finance team and banks for projects as they have a higher degree of certainty. At Solesca, we provide these numbers to you using bankable methods and any resource giving you the information in a readily-accessible format.
Understanding P50, P90, and P99 in solar energy
In the world of solar energy, P50, P90, and P99 represent the probability that a solar project will generate at least a specific amount of electricity in a given year. This article walks you through solar probabilities; why they are needed, how they are calculated, and how to use them.
If you work in solar you are destined to hear or come across the term P50 or P90 or P99. This, at first, is a very confusing concept. The ‘P’ stands for Probability and the number trailing it is the probability level (e.g. 50%, 90%, 99%). However, probability is inherently quite difficult to understand for us humans.
We like determinism; cause and effect. Don’t do homework, I get a bad grade on my test. Train for a sport and increase in aptitude. Stop doing cardio and I am out of breath after a flight of stairs. Cause: effect. But let’s drive to the gym, will I get into a car accident? The average American has a car accident every ±700,000 miles. Therefore, we would say that I probably won’t get into a car accident driving to the gym today. But, if I were to guarantee that over the next 40 or so years that I would spend 700,000 miles driving to the gym and back it is likely that I will get into an accident sometime over those 40 years. That is the essence of statistical probability, it can tell how likely something is given a domain.
In the world of solar energy, P50, P90, and P99 represent the probability that a solar project will generate at least a specific amount of electricity in a given year. Like using probability to determine if you will crash driving to the gym, I am endeavoring to walk you through solar probabilities; why they are needed, how they are calculated, and how to use them.
Solar is quite different from other generators of electricity, with the exception of wind. If you build a nuclear power plant, as long as the fissile material comes in and the human operators continue to show up you can all but guarantee the power output of the facility indefinitely. It is roughly deterministic. However, with solar we are dependent on, quite literally, the weather. The weather is not easy to predict. With weather being so unpredictable, how are we to determine the amount of sunlight that happens to hit the modules we placed in this location over a year or lifetime of the solar system? And it is here that we get part of our answer.
Do you know what the weather is going to be tomorrow? You can use any weather app and with a high degree of certainty know what the weather will be for tomorrow. How about this weekend? Well, for me it is five days away so I will keep an eye on it. What about 10 days from now? A Month? What about the wedding being planned for September? The further we are removed from a date the more difficult it is to predict the weather.
However, there is a funny thing about weather that works in the reverse. If you live in the northern hemisphere you know that June will be warmer than December, that April will likely have showers, and the leaves change in the fall. We can have more certainty about the latter statements than a prediction on a given date months out.
With that knowledge in hand, how do we use it to our benefit for solar? Lucky for us, the government funded research stations and private enterprise pays for satellite time to track the weather for every year and every location (at least in the US). We can get down to 5-minute data dating back decades. This is available via NREL (National Renewable Energy Lab) NOAA on-the-ground stations as well as satellite interpolators like SolarAnywhere, Solcast, and SolarGIS.
Temperature, wind, irradiance, cloud cover, precipitation, and much more are tracked and then used to develop a TMY (Typical Meteorological Year) file using a scientific process like the Sandia method. While the math is a bit complex, what we need to know is that 15 to 30 years’ worth of data is used to generate a typical year. The TMY file is then uploaded to your solar energy modeling software and is used to calculate how much energy will be produced by a system. This energy output is considered a P50 energy value and has typically been in an hourly format (8760). Fifty percent of the time the energy will be over, fifty percent under. But, over the lifetime of the system the average of the energy for all years (not counting degradation and unavailability differences year-to-year) will be very close to the output of the model.
So you have designed your system, used a good solar resource (or multiple to compare) to get a TMY file, and have generated a MWh (megawatt-hour) for the first year. You can take that and build a project, right? You can, but if you want to finance a project you will be unable to with a simple P50 number.
When financing a project, having a bank or outside entity give capital to cover the project cost, the organization will expect a rate of return with a high degree of certainty. A coin flip on any given year does not inspire confidence.
Lucky for us, we can use probability to determine a higher likelihood number to take to the banks! Many desire P90 and/or P99 numbers. A P90 means 90% likelihood the energy will be at or exceeding, with 10% being less than the given number. P99 is 99% over, 1% under. It is easiest to show the differences in a bell curve graph.
There are two ways of reaching a P90/P99 number from a P50. The first is to take the historical weather data and run multiple models to get a different TMY file. The second, and what Solesca uses, is to take the weather data and P50 data and augment it to P90 and P99 using a model developed in Geneva and widely accepted by the industry.
Both work and have proven to be bankable. If you want to get technical, the Geneva model takes the GHI from the system to get the variability, assumes a gaussian probability distribution, and uses the P50 data and variability to calculate the P values based on standard deviation.
Even though we can’t use these models to predict a given day or year to a high degree of accuracy, we can have a high degree of accuracy over the course of years. P50 numbers are used for asset managers as a target to hit for system production, and can be adjusted for weather. P90 and P99 numbers are used by the finance team and banks for projects as they have a higher degree of certainty. At Solesca, we provide these numbers to you using bankable methods and any resource giving you the information in a readily-accessible format.
Solesca is a US-based solar design software provider. Developers use Solesca to handle pre-sale design – drawing fields and obstructions, applying custom templates, running 8760 simulations, and sharing live designs with teammates. Whether it’s rooftop, carport, ground, or utility-scale, Solesca offers the tools to assess feasibility.
The views and opinions expressed in this article are the author’s own, and do not necessarily reflect those held by pv magazine.
This content is protected by copyright and may not be reused. If you want to cooperate with us and would like to reuse some of our content, please contact: editors@pv-magazine.com.


By submitting this form you agree to pv magazine using your data for the purposes of publishing your comment.
Your personal data will only be disclosed or otherwise transmitted to third parties for the purposes of spam filtering or if this is necessary for technical maintenance of the website. Any other transfer to third parties will not take place unless this is justified on the basis of applicable data protection regulations or if pv magazine is legally obliged to do so.
You may revoke this consent at any time with effect for the future, in which case your personal data will be deleted immediately. Otherwise, your data will be deleted if pv magazine has processed your request or the purpose of data storage is fulfilled.
Further information on data privacy can be found in our Data Protection Policy.