Researchers at Switzerland’s ETH Zürich have conducted an extensive analysis on the commissioning timelines of a set of renewable energy projects deployed worldwide between 2005 and 2022 and have found, surprisingly, that completion times increased on average over the past two decades.
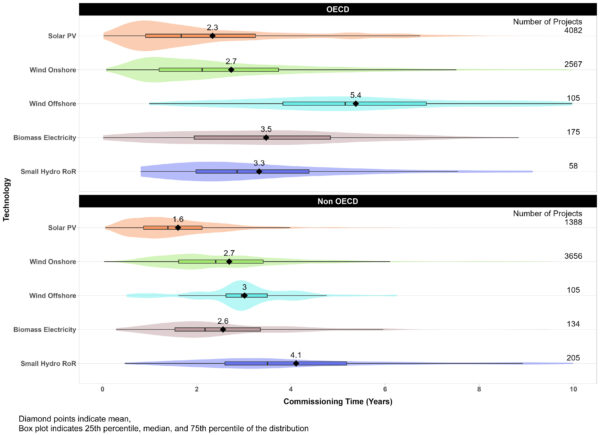
The academics investigated, in particular, the timelines of 12,475 projects using PV, wind onshore, wind offshore, biomass, and run-off-river hydropower spread across 48 countries. “The regions are defined as per World Bank country and lending group classification and sorted continently into Organisation for Economic Co-operation and Development (OECD) and non-OECD groups, as those in the OECD group tend to be wealthier countries,” they explained.
Their analysis considered project size, technology, project and developer characteristics, project site, and a project’s related market. They utilized project-level data sourced from Bloomberg New Energy Finance (BloombergNEF) and other country-level data and environmental data from the World Bank, the International Monetary Fund, and the Worldwide Governance Indicators, among others.
“We only considered projects where permitting and commissioning dates are recorded in the data and where a country has at least five transactions for any given technology,” the group specified. “The sourced data include details on installed capacity, names of actors developing the projects, project geocoordinates, permitting dates, and commissioning dates.”
One of the first conclusions drawn by the scientists is that, although PV is the technology that requires the least time to commission, the completion times for the deployment of utility scale solar plants in many countries increased from 2015 to 2022. “The findings further indicate that the mean time for deployment has increased for all technologies in the OECD and non-OECD groupings, except for biomass electricity in non-OECD countries,” they stated.
Referring to the critical factors that may delay projects, the academics said size has an “insignificant” impact and added that developers’ experience is, instead, a significant predictor of commissioning times, although only for PV and wind onshore. “This is likely due to low experience build-up in the other technologies due to relatively low deployment compared to solar PV and wind onshore,” they emphasized, noting that the presence of a domestic developer or a state-owned company may speed up deployment.
The analysis showed that completion times for PV and wind onshore increased by 0.5 years and 0.9–1.2 years respectively for OECD and non-OECD countries. “The upward trend also holds for different regions within the OECD and non-OECD groupings, with only Europe and Asia-Pacific showing a reduction in commissioning times for small hydro RoR and biomass electricity respectively,” the researchers noted.
The analysis also showed that factors such as currency devaluation and GDP contraction, as well as the COVID-19 crisis, had a significant impact on project timelines. It also showed that the average project size for solar PV during the 2005-2022 period is 17.3 MW in OECD countries and 34.4 MW in non-OECD countries.
The research group presented its findings in the study “A global analysis of renewable energy project commissioning timelines,” published in Applied Energy. “Future research could strengthen the econometric analysis with other potential factors and variables, and potentially apply them to energy technologies beyond renewables, such as electricity storage or grid assets, which might shed light on the robustness of our framework,” the scientists concluded.
This content is protected by copyright and may not be reused. If you want to cooperate with us and would like to reuse some of our content, please contact: editors@pv-magazine.com.


By submitting this form you agree to pv magazine using your data for the purposes of publishing your comment.
Your personal data will only be disclosed or otherwise transmitted to third parties for the purposes of spam filtering or if this is necessary for technical maintenance of the website. Any other transfer to third parties will not take place unless this is justified on the basis of applicable data protection regulations or if pv magazine is legally obliged to do so.
You may revoke this consent at any time with effect for the future, in which case your personal data will be deleted immediately. Otherwise, your data will be deleted if pv magazine has processed your request or the purpose of data storage is fulfilled.
Further information on data privacy can be found in our Data Protection Policy.