From pv magazine Global
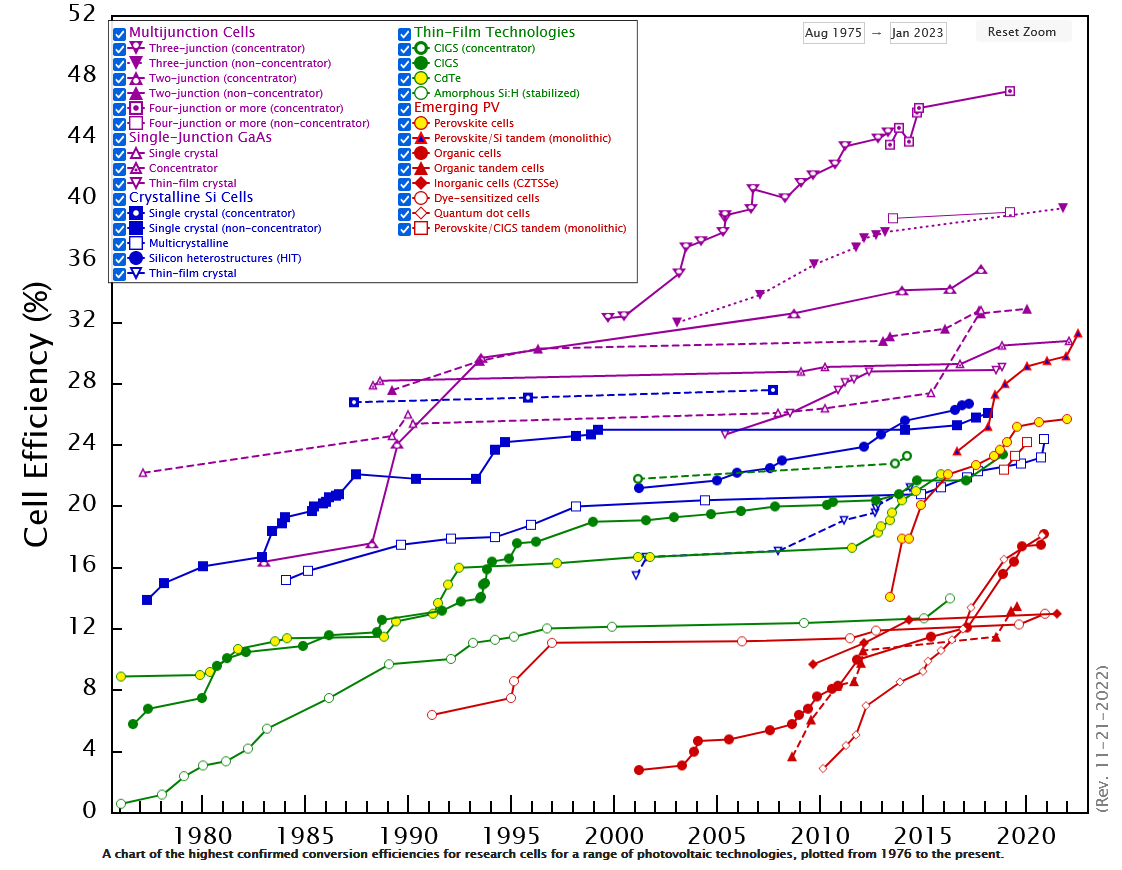
NREL has unveiled a new version of its Best Research-Cell Efficiency Chart. The tool highlights the highest confirmed conversion efficiencies of research cells for a range of PV technologies.
With the new interactive version, users can pull up decades of research data and compare custom charts that focus on specific technologies or time periods, NREL said in a statement. They can now find data on a cell’s current, voltage output, and fill factor, in addition to efficiency. The availability of those details will depend on the information in NREL’s records.
The highest research cell efficiency recorded in the chart is 47.1%, for a four-junction cell. Its interactive nature allows users to visualize the recent jump in conversion efficiencies for emerging technologies like perovskite solar cells. That contrasts with the steady improvement of silicon solar cell efficiency since the 1980s.
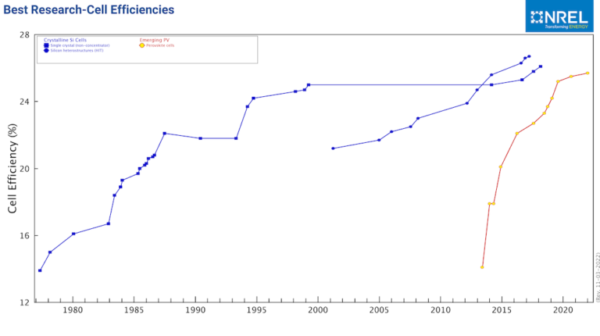
Image: NREL
“It’s possible that the NREL efficiency chart is the most presented graph that you can find at the annual PV Specialists Conference and similar conferences,” said Sarah Kurtz, senior research fellow at NREL. “But it has gotten so full that it’s difficult to see the data. With the new interactive chart, researchers will be able to still use the data, but present it in a way that communicates better for their talk.”
The cell efficiencies are measured by independent testing centers, including NREL, before earning a spot on the chart. All of the figures are also available as a downloadable file.
Join the pv magazine Webinar with NREL on Dec. 1: Understanding utility-scale solar and storage operations and maintenance cost drivers.
This content is protected by copyright and may not be reused. If you want to cooperate with us and would like to reuse some of our content, please contact: editors@pv-magazine.com.


By submitting this form you agree to pv magazine using your data for the purposes of publishing your comment.
Your personal data will only be disclosed or otherwise transmitted to third parties for the purposes of spam filtering or if this is necessary for technical maintenance of the website. Any other transfer to third parties will not take place unless this is justified on the basis of applicable data protection regulations or if pv magazine is legally obliged to do so.
You may revoke this consent at any time with effect for the future, in which case your personal data will be deleted immediately. Otherwise, your data will be deleted if pv magazine has processed your request or the purpose of data storage is fulfilled.
Further information on data privacy can be found in our Data Protection Policy.