A new analysis from Solcast data scientists using Microsoft’s Global Renewables Watch dataset offers a detailed look at solar generation across the planet in 2025. Drawing from a model based on Microsoft’s satellite-derived database of 86,410 commercial PV assets worldwide, the Solcast API was used to simulate hourly production data for the entire calendar year. The study reveals the global peak of solar output occurred on April 29 at 06:00 UTC, reaching an estimated 540 GW, and highlighting seasonal variability and geographic patterns in solar output. These findings are based on a large scale data analysis completed using Solcast irradiance data and the Solcast API.
To build this global generation model, Solcast applied a set of regional assumptions to Microsoft’s high-resolution satellite segmentation of PV assets. These market-based assumptions included estimates for each system’s capacity, azimuth, tilt, efficiency, and ground coverage ratio. Where possible, these estimates were cross-referenced with grid capacity data and scaled to national installed capacities to improve the robustness of capacity estimates and include behind the meter generation. The Solcast API was then queried to simulate hourly generation profiles for each site, producing an extensive global dataset of solar output.
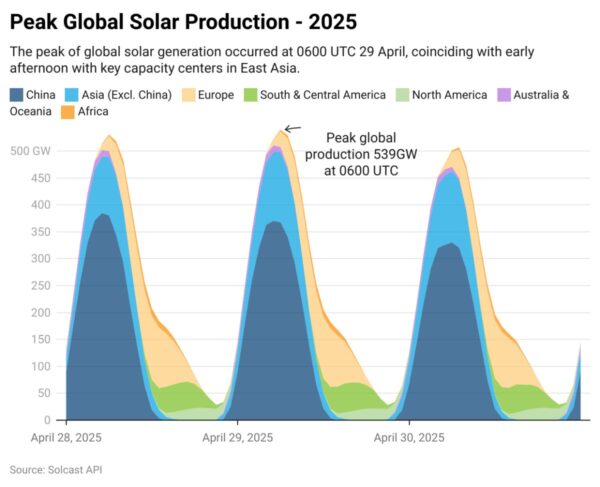
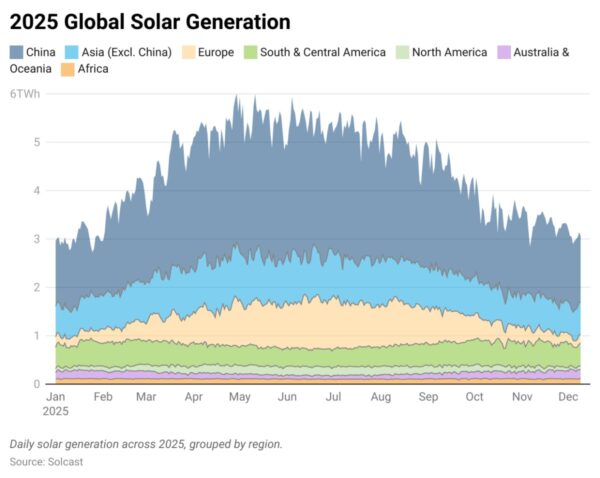
The model shows that global solar generation reached its peak on April 29, 2025. At 06:00 UTC, modelled generation peaked at 539 GW, marking the most productive hour of the year for solar assets worldwide. This time of day aligns with solar noon in India, early afternoon in China and East Asia, and morning in Central Europe, collectively representing many of the world’s largest solar-producing regions. The surrounding dates May 1, May 3, and May 11 saw similar peaks all at similar time of day, reinforcing that late April and early May likely delivered the most favorable combination of daylight and clear-sky conditions across key global markets. Total daily generation on April 29 reached approximately 6 TWh, roughly one-tenth of global daily electricity consumption. In contrast, daily generation dipped below 3 TWh during the Northern Hemisphere winter, with January registering the lowest totals.
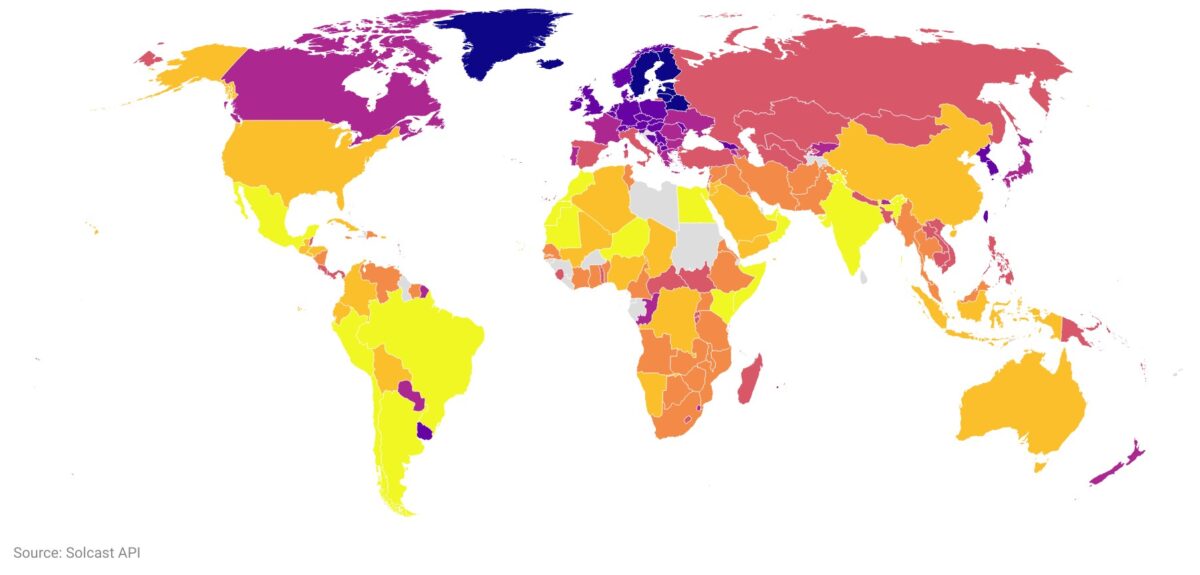
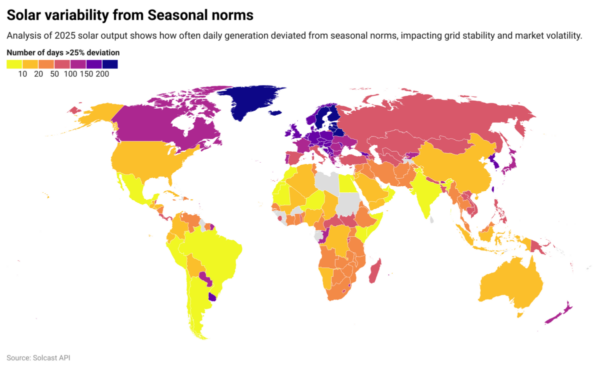
Beyond peak output, the dataset also illustrates the extent of solar generation variability. Using a metric that identifies days with national generation deviating more than 25% from seasonal averages, Solcast highlighted the degree of inter-day variability faced by grid operators. The most stable solar outputs can be observed to be associated with climatically stable regions, most typically arid areas, and in in countries with geographically dispersed solar fleets, such as India, Australia, the United States, and Brazil, where regional weather differences tend to average out. Still, the occurrence of high-variability days across all regions underscores the importance of accurate short-term forecasting in balancing grids dominated by variable renewables.
The views and opinions expressed in this article are the author’s own, and do not necessarily reflect those held by pv magazine.
This content is protected by copyright and may not be reused. If you want to cooperate with us and would like to reuse some of our content, please contact: editors@pv-magazine.com.


By submitting this form you agree to pv magazine using your data for the purposes of publishing your comment.
Your personal data will only be disclosed or otherwise transmitted to third parties for the purposes of spam filtering or if this is necessary for technical maintenance of the website. Any other transfer to third parties will not take place unless this is justified on the basis of applicable data protection regulations or if pv magazine is legally obliged to do so.
You may revoke this consent at any time with effect for the future, in which case your personal data will be deleted immediately. Otherwise, your data will be deleted if pv magazine has processed your request or the purpose of data storage is fulfilled.
Further information on data privacy can be found in our Data Protection Policy.