
Solar irradiation in summer 2025 remained largely consistent with long-term averages across the world, with most regions recording deviation within ±8%. However, new research shows that India was one of the regions that diverged more sharply from this range. The country’s solar resource availability is impacted by this year’s record-breaking monsoon season, deviating from historical trends observed over the last decade.
Heavy monsoons in India limit PV generation potential
Marked by an early arrival in June, India witnessed above-average precipitation and prolonged cloud cover through July and August, limiting the potential of PV generation across many states. Several regions, including Punjab, Haryana, and the Himalayan foothills, were hit hardest by flooding and thunderstorms. The increase in atmospheric moisture and aerosol scattering led to reduced Global Horizontal Irradiation (GHI) and reduced energy output.
Preliminary Solargis data indicates that in parts of North India, GHI values in July were about 15–20% below the long-term average, while western states such as Gujarat and Rajasthan saw delayed solar recovery in August due to lingering monsoon clouds. These regional fluctuations underline how high rainfall and changing cloud dynamics can disrupt solar generation patterns – a trend consistent with the rising frequency of heavy rainfall events across South Asia observed in the last decade.
The increasing severity of weather presents an additional challenge to India’s goal of reaching 500GW of renewable energy capacity by 2030, where solar comprises a major element and could contribute up to 300GW.
However, weather also offers lessons: project developers need to focus on modeling short-term and interannual weather variability more accurately to better plan modern PV systems, avoid energy yield surprises and financial underperformance. One way to ensure better preparedness for the consequences of extreme weather is using high-resolution solar and meteorological data to model PV performance.
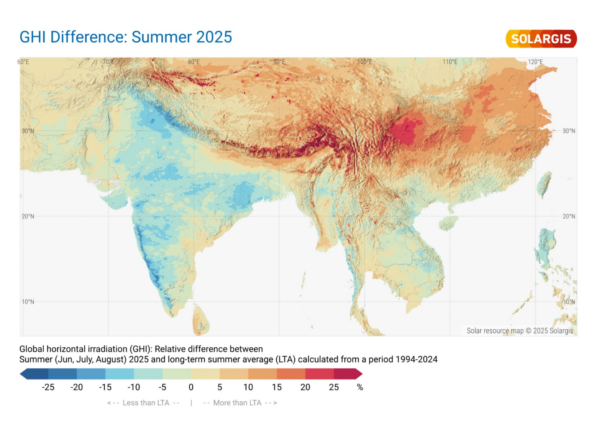
(Source: Solargis GHI difference maps: Summer 2025)
Why data granularity matters for mapping extreme weather
While Typical Meteorological Year (TMY) data has been widely used in project planning for its simplicity, it represents only a statistical “average” of past conditions. This means it smooths out extreme events such as intense monsoon spells, unusually long dry periods, or month-to-month variations: precisely the kinds of events that determine a project’s real-world resilience.
In contrast, Time Series (TS) datasets record sub-hourly conditions – often every 15 minutes or even one minute – across parameters such as irradiance, rainfall, temperature, and wind. This richer granularity allows developers to model how PV systems respond to actual meteorological fluctuations, not just idealized averages.
To illustrate this difference, imagine two data curves representing the same site during July. While the TMY curve would appear smooth and steady, showing an “average” daily irradiance profile, the TS curve would reveal the true pattern: multiple dips caused by fast-moving cloud clusters, rain events, or dust storms.
Such differences can translate into meaningful financial impacts. For example, developers with contractual penalties linked to monthly CUF (Capacity Utilization Factor) could underestimate risks if they rely solely on averaged data. A 15-minute time series analysis of recent summers would show that the frequency and duration of low-irradiance days during monsoon months have increased, helping developers anticipate performance shortfalls and adjust cleaning, maintenance, or energy trading strategies accordingly.
What’s next for India?
One of the key takeaways for solar developers from this year’s strong monsoons is the impact of climate driven volatility on solar projects. Indian monsoons are annual, recurring events that are increasingly unpredictable – suggesting that developers need to brace for uncertainty. As Indian solar developers prepare to tackle the challenges heavy monsoon seasons and other unforeseen climate-caused events bring with them, it is essential that they have the most accurate and near-real-time data as possible to inform business decisions.
Even in the absence of local measurement stations, modern satellite-based Time Series data provides up to 27 years of continuous records in South Asia at 15-minute resolution, giving developers a reliable statistical foundation for site evaluation, energy yield modelling, and operational benchmarking.
This year’s record monsoon season is a reminder that data precision is not a luxury; it’s a necessity for risk management. As India advances toward its 2030 renewable energy goals, leveraging granular, physics-based datasets will be key to improving system reliability and investor confidence.
The views and opinions expressed in this article are the author’s own, and do not necessarily reflect those held by pv magazine.
This content is protected by copyright and may not be reused. If you want to cooperate with us and would like to reuse some of our content, please contact: editors@pv-magazine.com.


By submitting this form you agree to pv magazine using your data for the purposes of publishing your comment.
Your personal data will only be disclosed or otherwise transmitted to third parties for the purposes of spam filtering or if this is necessary for technical maintenance of the website. Any other transfer to third parties will not take place unless this is justified on the basis of applicable data protection regulations or if pv magazine is legally obliged to do so.
You may revoke this consent at any time with effect for the future, in which case your personal data will be deleted immediately. Otherwise, your data will be deleted if pv magazine has processed your request or the purpose of data storage is fulfilled.
Further information on data privacy can be found in our Data Protection Policy.