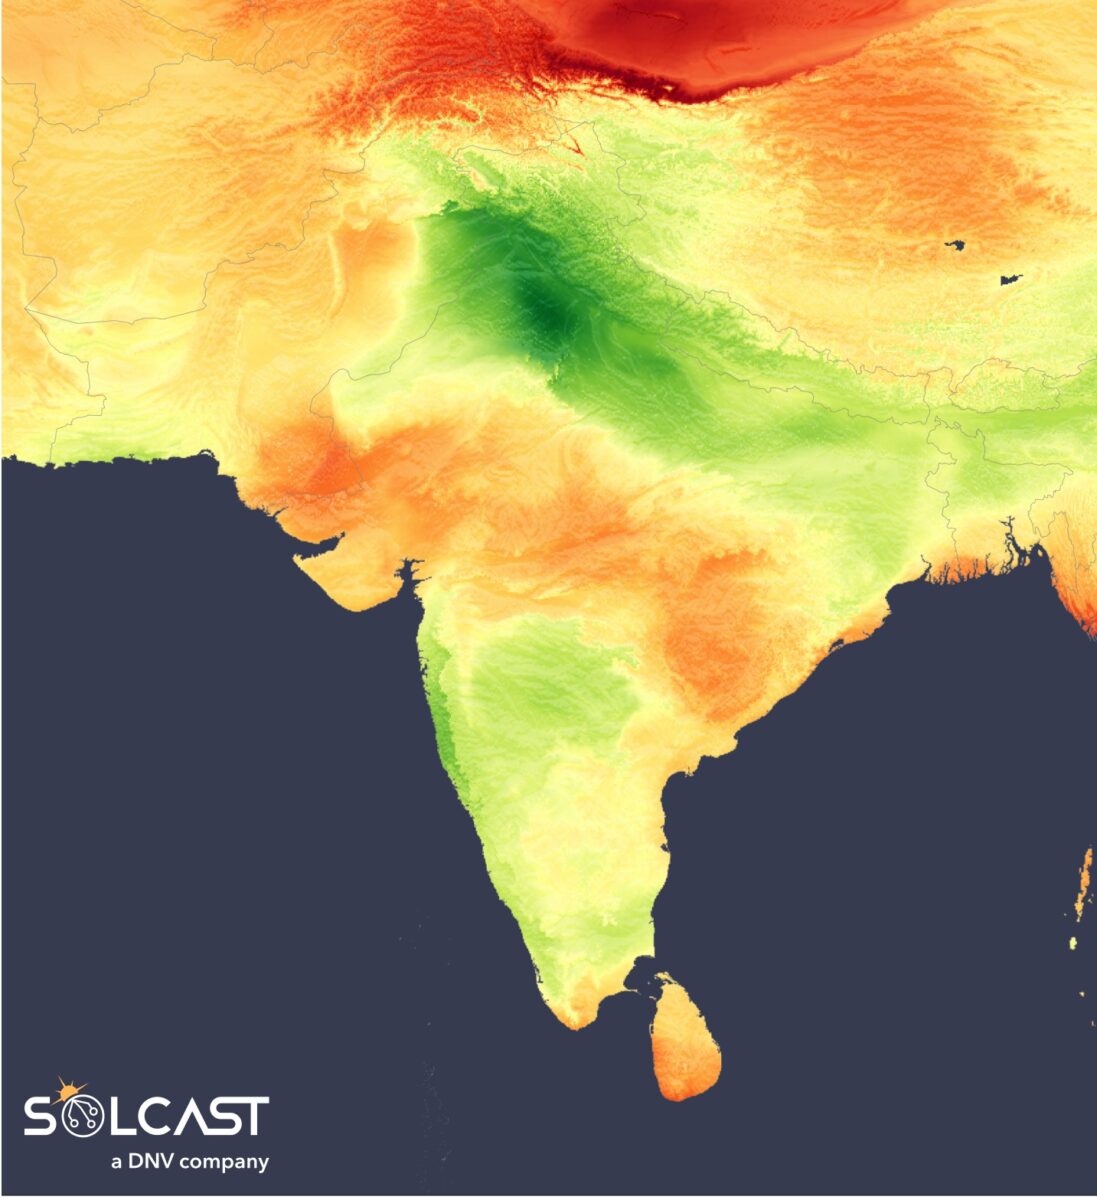
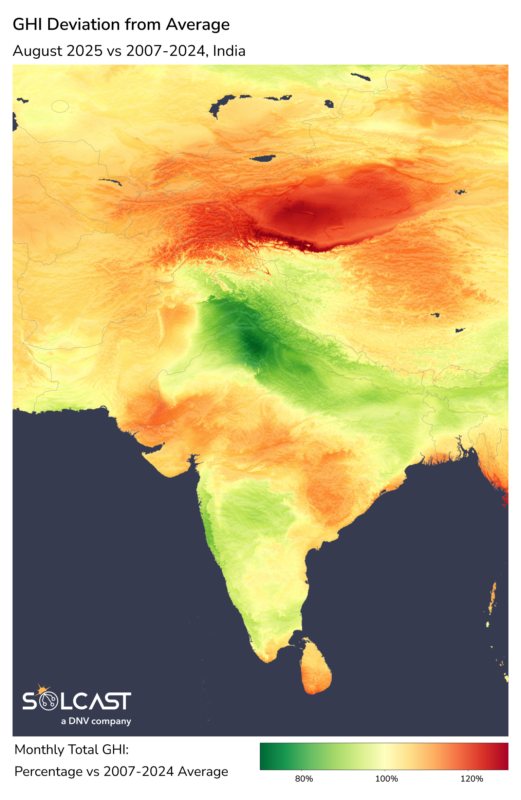
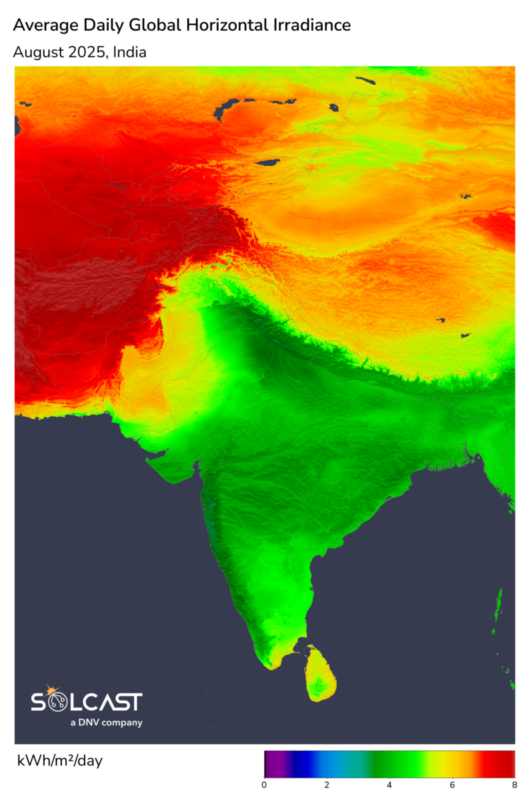
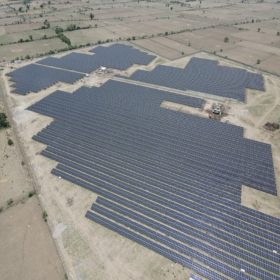
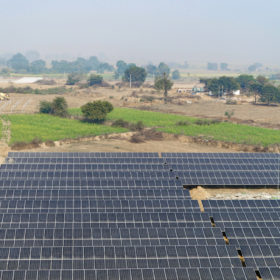
India’s 2025 southwest monsoon season arrived earlier than usual but progressed northward more slowly, leading to erratic rainfall and significant irradiance variability across the country. According to analysis using the Solcast API, irradiance fell by as much as 30% in northern regions under persistent cloud cover, while central India saw unexpected solar gains.
The early onset of the monsoon was driven by a combination of ocean and atmospheric conditions. In mid-May, tropical weather activity boosted convection over the Indian Ocean, increasing thunderstorm development and setting the stage for early rainfall. A stronger-than-usual high-pressure system over the southern Indian Ocean, known as the Mascarene High, together with accelerated cross-equatorial winds, known as the Somali Jet, rapidly transported moisture northward toward India. At the same time, a persistent low-pressure system over northwest India and Pakistan helped pull in additional moisture, strengthening the overall circulation. These interacting patterns contributed to the monsoon arriving ahead of schedule.
Despite the early start, August irradiance outcomes varied significantly across regions. In the north, heavy cloud cover and ongoing rainfall led to irradiance levels approximately 30% below the monthly average. In contrast, central India experienced a break in monsoon activity that allowed for clearer skies and a 15% increase in irradiance compared to typical August values. In the south, persistent cloud cover sustained by moisture-laden Somali Jet inflows suppressed irradiance by around 10% below normal. Meanwhile, in the far east, including states like Assam and Meghalaya, irradiance also remained below average, even though rainfall decreased, due to widespread but non-rain-producing cloud cover.
The southwest monsoon brought disruption to energy infrastructure through flooding events and associated landslides. Impacts have been particularly felt in northern India, where components of distribution networks including transformers and power lines were widely impacted. The human toll of these events included deaths by electrocution from downed power lines.
Solcast produces these figures by tracking clouds and aerosols at 1-2km resolution globally, using satellite data and proprietary AI/ML algorithms. This data is used to drive irradiance models, enabling Solcast to calculate irradiance at high resolution, with typical bias of less than 2%, and also cloud-tracking forecasts. This data is used by more than 350 companies managing over 300 GW of solar assets globally.
The views and opinions expressed in this article are the author’s own, and do not necessarily reflect those held by pv magazine.
This content is protected by copyright and may not be reused. If you want to cooperate with us and would like to reuse some of our content, please contact: editors@pv-magazine.com.


By submitting this form you agree to pv magazine using your data for the purposes of publishing your comment.
Your personal data will only be disclosed or otherwise transmitted to third parties for the purposes of spam filtering or if this is necessary for technical maintenance of the website. Any other transfer to third parties will not take place unless this is justified on the basis of applicable data protection regulations or if pv magazine is legally obliged to do so.
You may revoke this consent at any time with effect for the future, in which case your personal data will be deleted immediately. Otherwise, your data will be deleted if pv magazine has processed your request or the purpose of data storage is fulfilled.
Further information on data privacy can be found in our Data Protection Policy.