From pv magazine Global, September edition
A small spot on the right edge of China is illuminated on a map. It is the location of a multi-megawatt power plant. The plant could have produced 2.54 GWh in the past 153 days, but in fact it generated 2.32 GWh. “Some of the losses could have been avoided,” says Kam Mofid, General Manager Solar for the Americas and head of the Global Solar Center of Excellence at Envision. The company has invested in big data cloud computing and developed the EnOS Ensight analysis software and platform to help plant owners keep yield deviations from the optimum as low as possible – 2.54 GWh is not some idealized figure, but what the plant is capable of supplying if the corrective actions proposed by the platform are implemented, says Mofid.
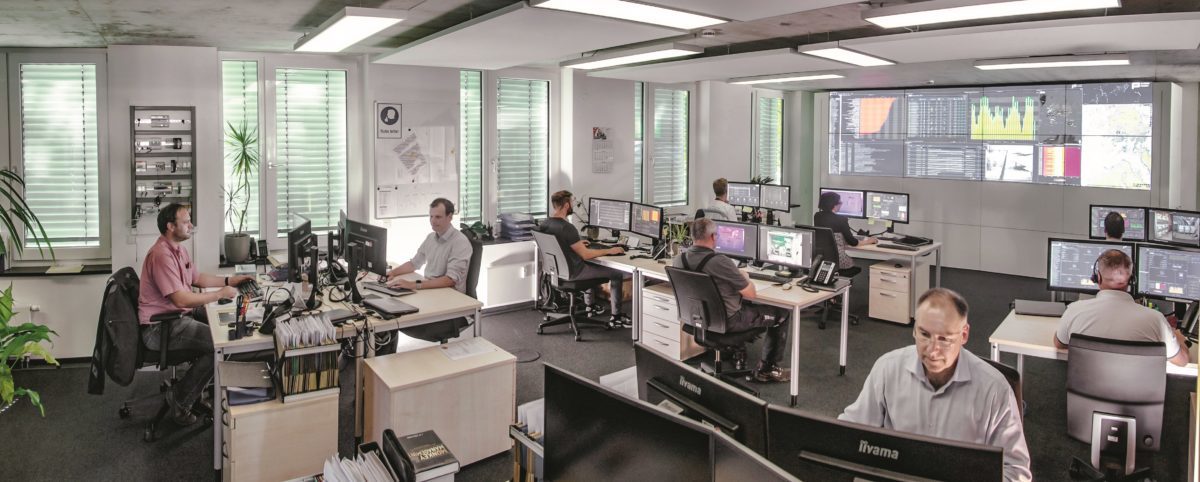
Real-time visualization
Pressure to reduce operating costs is enormous. As recently as a few years ago, plant owners were paying €30/kW per year, which was possible given the high feed-in tariffs in Germany at the time. Today, it is €5 or less for large power plants, depending on the scope of services included.
The beginnings of operations management seem unimaginable today. “Initially we were working with an analog modem and were happy to get a data dump from the previous day,” recalls Stefan Rensberg, Head of Product Management at monitoring pioneer Meteocontrol. “Today we have two-way communication with real-time visualization.” Key performance indicators have also continued to develop. They used to be technical, now they are increasingly financial. “Managers today have to guarantee a performance ratio and prove it with earnings,” says Rensberg.
In addition, the systems and their alerts have become much smarter. False alarms have to be avoided to prevent unnecessary deployment of technicians. The control room, rather than staff on the ground, is increasingly assessing which measures need to be taken with the help of the monitoring platform. According to Meteocontrol, it helps to compare data from different plants in a region. Kam Mofid wants to enable plant managers to make the clearest possible decisions by displaying a bar chart on the dashboard attributing losses to a dozen or so error modes. At the plant in Western China, the ‘snow cover’ bar shows that snow was responsible for 3.2% of losses over the past 153 days. Shading reduced the yield by 2.8%. The “Inverter downtime” bar shows that it was the third-place loss-maker at 2%. By clicking on the timeline, you can immediately adjust the period for which the losses are calculated.
“For our analyses we need nothing more than the usual SCADA data from the inverters, weather stations, and possibly also from soiling sensors, which are sometimes installed in larger systems,” says Mofid. The rest is provided by auto- mated analysis and a deep dive into the breakdown of energy losses that he and his development team in Silicon Valley have perfected over the past 24 months.
Euros and cents
In a figurative sense, the interface allows us to “peel the onion” and dive deeper into individual categories, continues Mofid. If you click on the inverter menu item, you see, for example, that certain inverters were down for several hours during the past week. This cost the operator $2,113. Another inverter suffered a high number of self restarts, resulting in $1041 in lost revenue. String performance is also priced. It cost $315 that 1,075 strings delivered less than 90% of the output of their neighboring strings.
The USP seems to be that the analysis tool puts an exact figure on system faults. “I find it impressive that Envision dares to price faults so precisely,” says Roger Zetzmann of Enovo Renewables O&M, pointing to the usual measurement tolerances of around 4%. The various software systems he currently uses do not provide such figures, perhaps for good reason. Just how good such failure analyses are for individual failure modes is a matter of discussion among experts.
Meteocontrol is also working on something similar. In the future, modern training methods will compensate for measurement inaccuracies in the field, for example in inverters or string measurement devices, according to Stefan Rens- berg. The Meteocontrol VCOM platform enables a more complex analysis of the failures caused by an error message by clicking in the corresponding window. Proving that analysis and pricing are sufficiently accurate is not easy for Envision either. Though the latest analysis products have only been on the market a few months, feedback has already been positive, says Mofid. “A number of large utilities and IPPs who are either in the trial process or in actual full commercial deployment have provided us very positive feedback on the software’s capabilities to improve performance,” he says.
Snow and soiling
Snow is considered one of the biggest challenges. “It is probably easier to account for how a snow front will approach,” says Zetzmann. “But you also have to consider how the snow melts.” When mistakes compound, it becomes even trickier. Envision calculates snow-based losses using a combination of data. For example, temperatures near the freezing point and the time series for yield and insolation are taken into account. Snow losses create a unique pattern of how the difference between expected and measured power develops over the course of the day, explains Pascal Wehrli, who has taken the lead in algorithm development.
Soiling is also a major issue. The software can distinguish these losses from other types of losses using algorithms that account for the influence of rainfall and the yield curve during dry periods, explains Wehrli. This, he says, eliminates factors not related to soiling. Ultimately, the various providers are likely taking similar approaches. The details of where their approaches differ can be difficult to distinguish for outsiders. Meteocontrol is working on methods to break down the effects of faults, and it analyzes time series data from previous years up to the present day. The company also uses webcams and weather data from satellites to detect shading and snow cover.
A big challenge is avoiding what IT professionals call “garbage in, garbage out,” a recurring trap in any big data analysis. According to Mofid, Envision has put significant effort into this. The problem can be addressed with “advanced filtering algorithms” for the raw data, he says. Meteocontrol provides replacement values for that purpose, even in the current program versions, says Rensberg.
One of the most difficult questions is which losses are worth avoiding and which are not. After all, the amount of loss is not the only factor taken into consideration, but also the effort involved in cleaning, clearing snow, or repairing inverters. Enovos expert Roger Zetzmann points out that snow removal is very rarely worthwhile. “Snow falls in the months with the lowest yield and often slips off on its own,” he says. If it does not fall off by itself it cannot be removed from the modules with simple means such as brushes. In other words, the effort increases. However, this likely depends on the region in which the plant is located. Because how long snow remains, how often it snows, and the angle at which modules are installed varies greatly.
At the end of the day, the technical operations manager has to assess which efforts are worthwhile and which are not. To help with this, in future versions of Envision’s platform, managers will be able to configure the software to take advantage of their experience. “For example, it can be configured so that it only issues a notification if short-term savings exceed $1,000 to justify the deployment of a technician on-site,” says Pascal Wehrli. Or it can display what the corrective actions cost, so that the software can calculate payback times.
The role of automation
Automation in plant management will go even further. Today, control room staff monitor between 10 and 100 MW, depend- ing on the degree of automation already in place and the scope of the service contract. As automation progresses, megawatts per employee will increase and operators will have more time for new tasks. “A very high level of automation for alerts is both important and possible,” says Michèle Rascher. He is the Managing Director of Raising Power, a wholly-owned subsidiary of Meteocontrol and service provider for operations managers. “But error detection doesn’t work entirely without human influence.” Human Resource efficiency per MW could be improved by a factor of 10. Raising Power has also developed a system called “Asset Coaster,” which works out procedures for troubleshooting once a fault is detected. As much as 40% of costs could be saved in this area, says Rascher. “Operators must also explain to the owners if, for example, when curtailment leads to $100,000 or $200,000 in lost revenue per month,” says Kam Mofid of Envision. First, because they require transparency, and second because intelligent data analysis not only enables further devel- opment of operations management but also of solar power plant planning. Owners want to know, for instance, which loss mechanisms are unavoidable in a power plant, such as losses due to row shading. “They can then turn to the original installer or learn how to design systems better for future projects.” After all, most owners also invest in new plants on an ongoing basis, he adds.
Envision is an example of how quickly new players can develop asset management tools, but the company also has the appropriate resources to do so. It is based in Shanghai, operates globally and has branches in Europe, the USA, and South America. According to Mofid, it is number 10 worldwide and number two in China for turbines in wind farms. In its digital arm, Envision Digital, it works on Internet of Things applications in the field of energy. It is here that the operations management platforms for wind and solar power plants are developed. Envision Ventures also invests in new cleantech companies and startups in Silicon Valley. For example, it is one of the largest investors in sonnen.
A German startup
Startup company Solytic may well develop into a kind of Envision. About a year ago Johannes Burgard, Alwin Nagel and Konrad Perenyi officially spun off from the Berlin company builder Factor 10. It also has a deep-pocketed investor: Vattenfall has invested €3 million and made some systems available that run with the newly developed monitoring and analysis software. Solytic’s 21 employees are also working on an intuitive, simple display for operations managers, as well as on data analysis. The first version already works, according to the company. Later in the year, a more automated fault detection system will be ready for deployment. Smart alerts are sent to specified actors in real time using the client function.
Solytic’s Perenyi explains that there is room for improvement over standard products in use today. In general, he wants to make the performance of strings within a system and between systems installed at different locations more comparable. Among other things, the insolation val- ues from satellite data and sensors have to be more accurately recalculated to the inclined planes of the modules. As a final step, Solytics uses a computer to model the components of the systems in a so- called digital twin, a process that Oliver Wyman’s management consultants also describe as a key digitalization technology for solar plant monitoring. This will make it easier to identify discrepancies between target and actual performance, and weaknesses.
Predictive maintenance on the rise
Experts are still waiting for further developments in the key technology of predictive maintenance. In its advanced form, it is not yet a major factor in practice. But one goal of digitalization experts across a wide range of industries is to use sensors and data analysis to help warn operations managers in advance which components will fail. These can then be replaced in advance.
DuPont is now interested in this issue, and announced a collaboration with Envision at the beginning of the year. The aim is to develop forward-looking analysis for the degradation of previously installed solar modules. The manufacturer of components for backsheets is already very active in field testing, in which experts quantitatively evaluate the defects in exist- ing plants and collect information on the quality of various backsheet film materials. The aim now is to automate data collection and improve the analysis of “aging solar installations.” This helps to ensure that the energy yield is as high as possible until the end of its service life, explains Stephan Padlewski, Regional Marketing Leader at DuPont Photovoltaic Solutions.
By Michael Fuhs
This content is protected by copyright and may not be reused. If you want to cooperate with us and would like to reuse some of our content, please contact: editors@pv-magazine.com.


By submitting this form you agree to pv magazine using your data for the purposes of publishing your comment.
Your personal data will only be disclosed or otherwise transmitted to third parties for the purposes of spam filtering or if this is necessary for technical maintenance of the website. Any other transfer to third parties will not take place unless this is justified on the basis of applicable data protection regulations or if pv magazine is legally obliged to do so.
You may revoke this consent at any time with effect for the future, in which case your personal data will be deleted immediately. Otherwise, your data will be deleted if pv magazine has processed your request or the purpose of data storage is fulfilled.
Further information on data privacy can be found in our Data Protection Policy.